Models & Products
Global Evapotranspiration
Project Summary
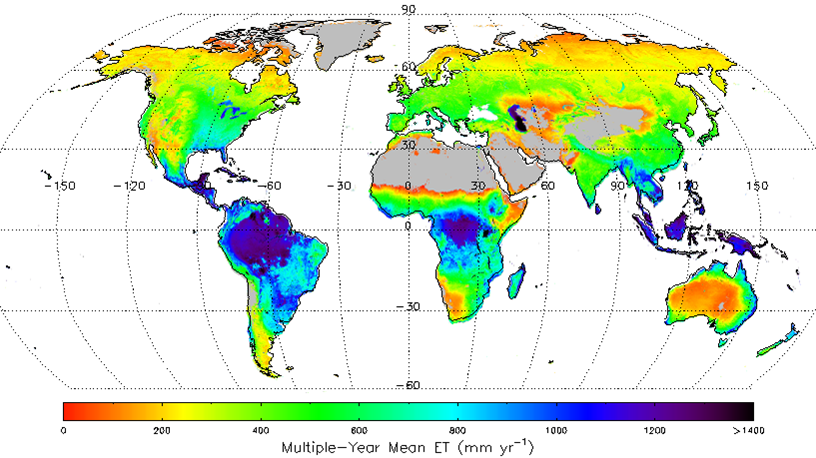
The objective of this study was to generate a global long-term (1983-2013) daily ET record with well quantified accuracy for studies on regional/global water balances changes. We applied a satellite remote sensing based evapotranspiration (ET) algorithm to assess global terrestrial ET. The algorithm quantifies canopy transpiration and soil evaporation using a modified Penman-Monteith approach with biome-specific canopy conductance determined from the NDVI, and quantifies open water evaporation using a Priestley-Taylor approach. These algorithms were applied globally using AVHRR GIMMS NDVI, NCEP/NCAR Reanalysis (NNR) daily surface meteorology and NASA/GEWEX Surface Radiation Budget (SRB) solar radiation inputs. We used observations from FLUXNET tower sites representative of the major global vegetation types to parameterize an NDVI-based canopy conductance model and then validated the global ET algorithm using measurements from additional, independent flux towers. The global ET results capture observed spatial and temporal variations at the global scale and also compare favorably (RMSE=186.3 mm yr-1; R2=0.80) with ET inferred from basin-scale water balance calculations. These data provide a relatively long term global ET record with well-quantified accuracy for assessing ET climatologies, terrestrial water and energy budgets and long-term water cycle changes.
Publications
Zhang, K., J.S. Kimball, R.R. Nemani, S.W. Running, Y. Hong, J.J. Gourley, and Z. Yu, 2015. Vegetation Greening and Climate Change Promote Multidecadal Rises of Global Land Evapotranspiration, Scientific Reports, 5, 15956; doi: 10.1038/srep15956.
Zhang, K., J.S. Kimball, R.R. Nemani, and S.W. Running, 2010. A continuous satellite-derived global record of land surface evapotranspiration from 1983-2006. Water Resources Research doi:10.1029/2009WR008800.
Zhang, K., J.S. Kimball, Q. Mu, L.A. Jones, S.J. Goetz and S.W. Running, 2009. Satellite based analysis of northern ET trends and associated changes in the regional water balance from 1983 to 2005. Journal of Hydrology 379, 92-110.
Metadata
| Spatial Resolution | 1 degree or 8 Kilometers |
| Rows | 2091 |
| Columns | 4950 |
| Lat Long NW | 89.2234 -179.9954 |
| Lat Long SE | -62.8494 180.0046 |
iCRESTRIGRS
integrated Coupled Routing and Excess Storage and Transient Rainfall Infiltration and Grid-Based Regional Slope-StabilityModel Introduction
The objective of this study is to develop a coupled flood-landslide forecasting model system that can be forced by satellite- or radar-based Quantitative Precipitation Estimation (QPE) systems. The iCRESTRIGRS model is a distributed flood and landslide prediction model based on physical mechanism, coupled hydrologic process and soil mechanics process. Its spatial resolution can range from meters to hundreds kilometers, depending on whether we can get high resolution input data and basic data. The time resolution of the model can reach 10 minutes, and it also depends on whether we can get high-resolution input data. The iCRESTRIGRS model can not only simulate important hydrological processes (including evapotranspiration, runoff generation, confluence, etc.), but also calculate the slope stability of each grid. This coupled model consists of two parts: the CREST hydrological model and the TRIGRS slope stability model.
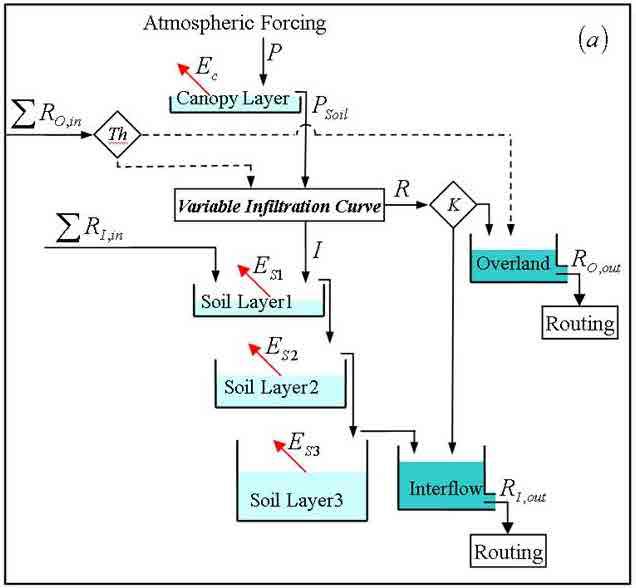
CREST model The CREST model is a grid-based distributed hydrological model and it partitions net precipitation into surface runoff and infiltration using the variable infiltration capacity curve (VIC). Multi-linear reservoirs are used to simulate cell-to-cell routing of surface and subsurface runoff separately. The CREST model uses a cell-to-cell routing scheme to route overland flow to downslope cells where it is further partitioned to infiltration and overland flow moving downslope using the VIC based runoff generation scheme. The SCE-UA (shuffled complex evolution method) optimization scheme is implemented to automatically calibrate the distributed model parameters.
TRIGRS model The TRIGRS model computes transient pore-pressure changes and attendant changes in the factor of safety (FS) due to rainfall infiltration using a two-layer system that consists of an unsaturated zone above a saturated zone. This model links analytical solution for transient, unsaturated, vertical infiltration above the water table to pressure-diffusion solutions for pressure changes below the water table. The solutions are linked through a transient water table that rises as water accumulates at the base of the unsaturated zone. Pore pressures computed by the models are subsequently used in one-dimensional slope-stability computations to estimate the timing and locations of slope instability. The TRIGRS model assumes that water can infiltrate with a maximum infiltration rate at each grid cell. It also has a simple surface runoff routing scheme for water movement from cells that have excess surface water to adjacent downslope cells where it can either infiltrate or flow farther down slope.
In this coupled model, the CREST model computes all hydrologic storages and fluxes, including interception by vegetation, infiltration, runoff generation, water routing, and re-infiltration of excess surface runoff from upstream cells to downstream cells, and provides the initial conditions, e.g. soil wetness and depth of water table. The TRIGRS model is implemented to compute pore-pressure and slope stability correspondingly by using parameters and initial conditions provided by CREST model. In the end, the hydrological process of the region and the instability of the slope can be obtained, and the flood and landslide can be predicted.

Publication
Zhang K, Xue X, Hong Y, Gourley JJ, Lu N, Wan Z, et al. iCRESTRIGRS: A coupled modeling system for cascading flood-landslide disaster forecasting [J]. Hydrology & Earth System Sciences Discussions. 2016:1-23.
Metadata
| Precipitation | QPE product based on gauge and radar observations |
| Evapotranspiration | daily satellite remote sensing based ET record |
| DEM | 3″ DEM from USGS |
| Landcover | 30-m National Land Cover Database |
| Soil type | the State Soil Geographic |
| streamflow | streamflow observations from USGS streamflow gauges |
| Landslide events | Locations of landslide events from the North Carolina Geological Survey |
P-LSH algorithm
Introduction of algorithm
The remote-sensing-driven ET algorithm used in this study is called Process-based Land Surface Evapotranspiration/Heat Fluxes algorithm (P-LSH). P-LSH quantifies canopy transpiration using the Penman-Monteith (PM) approach coupled with biome-specific canopy conductance determined from NDVI, soil evaporation through a modified PM approach, and open water evaporation using the Penman equation. In this study, we made the following improvements to the baseline algorithm to account for the influence of variable wind speed and atmospheric CO2 concentrations on respective model aerodynamic conductance and canopy stomatal conductance terms, and resulting ET calculations: (1) quantify the impacts of increasing atmospheric CO2 concentrations on canopy stomatal conductance through a CO2 constraint function used in the MOSES land surface scheme, (2) use surface wind speed to calculate aerodynamic conductance following Monteith and Unsworth, and (3) replace the Priestley-Taylor method in the base algorithm with Penman equation to estimate open water evaporation and potential evaporation (PET) for considering the impacts of changes in surface wind speed on open water evaporation.
Publications
Zhang, K., J.S. Kimball, R.R. Nemani, S.W. Running, Y. Hong, J.J. Gourley, and Z. Yu, 2015. Vegetation Greening and Climate Change Promote Multidecadal Rises of Global Land Evapotranspiration, Scientific Reports, 5, 15956; doi: 10.1038/srep15956.
Metadata
| Daily surface meteorology records | NCEP Reanalysis |
| satellite remote sensing data | NASA SRB datasets |
| precipitation and discharge records | GPCP, GPCC, CRU, global basin observed monthly river discharge data |
Soil moisture product
Brief introduction
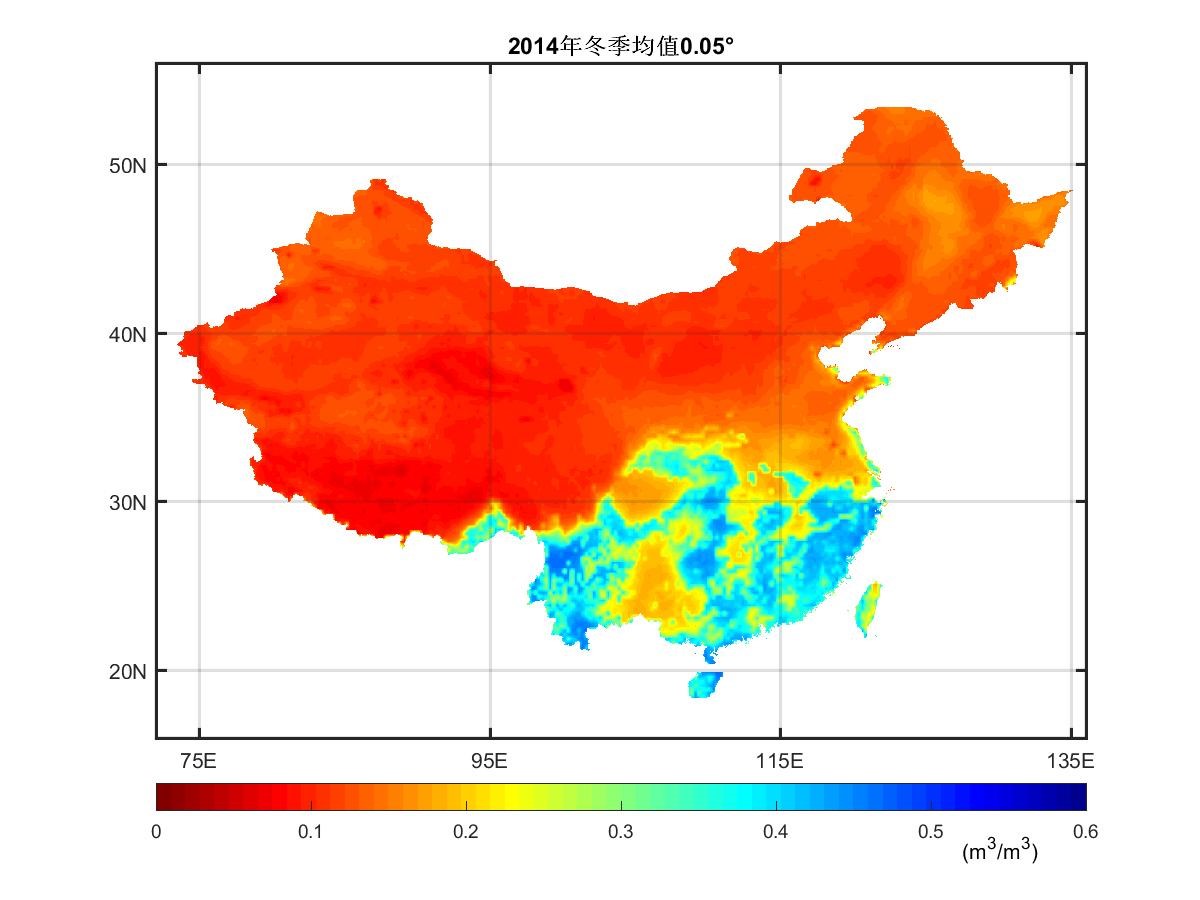
Soil moisture monitoring with high spatial and temporal resolution based on multi source satellite data includes two parts: One is that soil moisture inversion based on multi satellite data and space-time reconstruction. The other is that soil moisture inversion in high spatiotemporal resolution. First, the model of soil moisture inversion based on microwave is constructed. It includes the conversion of light temperature and emissivity, the quantification and elimination of the influence of vegetation and surface roughness, the backstepping of the correlation between soil dielectric constant and emissivity and the backstepping of correlation between soil moisture content and soil and dielectric constant. The soil moisture data extracted from different satellite sources (including SMAP, SMOS, AMSR2 and Fengyun series satellites) are integrated and spliced. It will produce a national land surface moisture product with a spatial resolution of 0.25 degrees and a temporal resolution of one day. Then the soil moisture calculation model (Soil Water Balance Model: SWBM) based on physical mechanism and process is constructed. It includes the calculation module of infiltration, the calculation module of actual evapotranspiration, the module of slope surface flow infiltration, the module of water exchange between soil layers and the module of soil water leakage. It will produce a national land surface moisture product with a spatial resolution of 0.05 degrees. Finally, the two kinds of products are fused by the method of cross scale data fusion. Then soil moisture product with high spatial and temporal resolution can be got. It can not only produce soil moisture in high spatial resolution, but also make full use of satellite remote sensing information to ensure the accuracy of inversion.
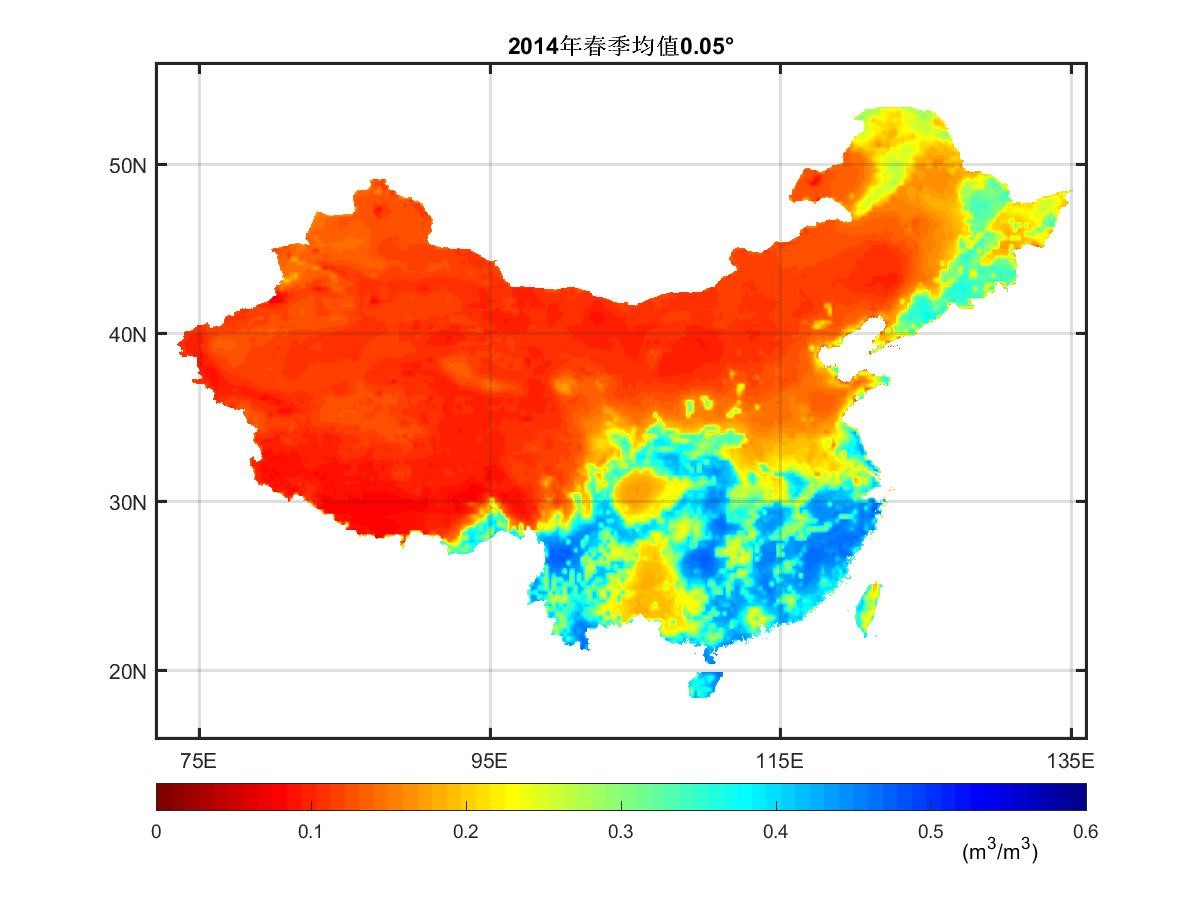 |
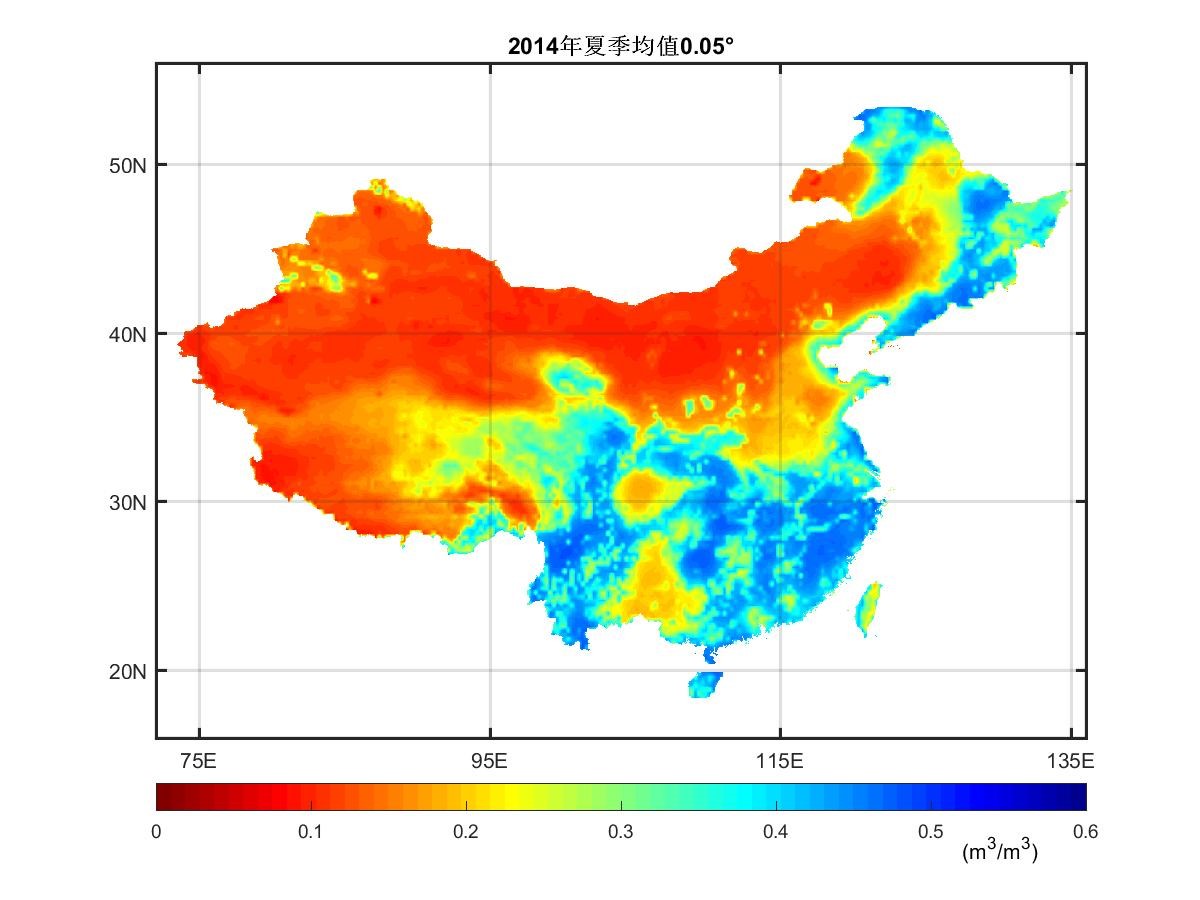 |
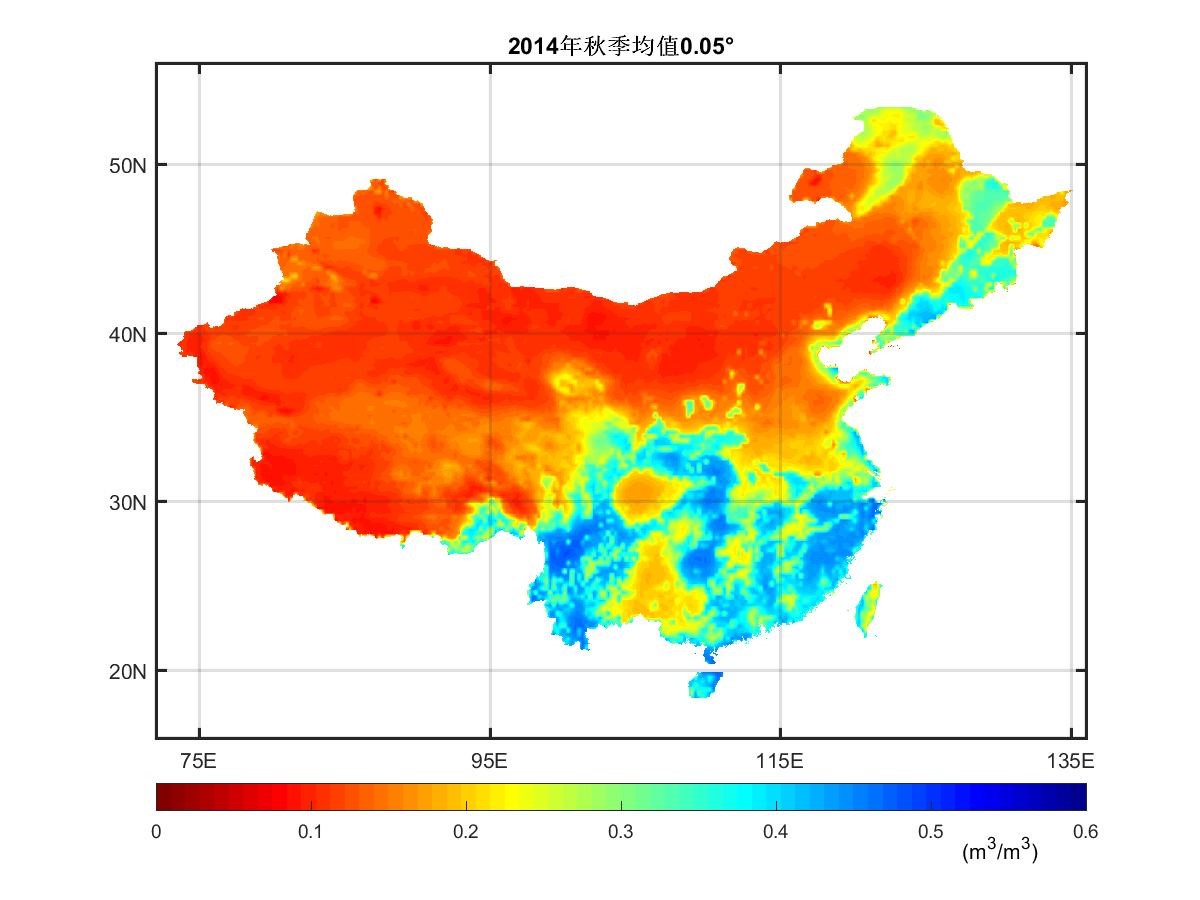 |
 |
GTOPMODEL
Grid-and-TOPgraphy-Based Hydrological MODELModel Introduction
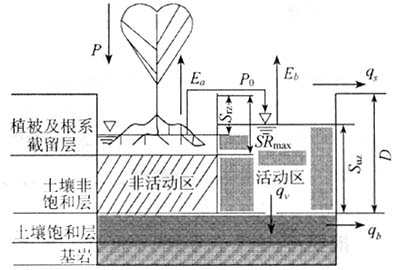
The basic equations in GTOPMODEL which can reflect the relationship between average soil water shortage of unit conflux zone and soil water shortage of a single grid were deducted by assuming that the soil saturated hydraulic conductivity decreases exponentially with the increase of soil depth and the surface of groudwater parallel to the ground surface. According to single flow method, the drainage grid was extracted from DEM to establish the topological relation between grids. On the basis of watershed division, the runoff generation was calculated at each grid. The grid is divided into 3 layers in vertical: the vegetation and root interception layer, unsaturated soil layer and saturated soil layer. Finally, according to the D8 method, the outflow direction of each grid was calculated and then the drainage network and grid calculation order matrix were generated and established, respectively. The outflow process was obtained by using the Muskingum conflux algorithm in each grid unit.
Publications
Zhang K, Li Z.J., Bao H.J. 2005. Comparison between GTOPMODEL and TOPMODEL. Journal of Hohai University (NATURAL SCIENCE EDITION). 2005 (05): 509-12.
Metadata
| Precipitation | Observation data from rainfall gauge stations |
| Runoff | Sub flood data, time interval 1h |
| DEM | 30″×30″DEM data from USGS |
| Soil type | resolution 1 degree from NOAA satellite |
| Landcover | resolution 30 second from USGS |
CRESLIDE
Coupled Routing and Excess Storage and SLope-Infiltration-Distributed EquilibriumModel Introduction
The research objective is to decipher the climatic and earth surface processes by employing satellite remote sensing data within a physically based integrated hydrology and landslide modeling continuum. In this study, the SLIDE landslide prediction model as a module was integrated into the modular-in-design hydrological model CREST. This model can alleviate the chronic flaws of landslides simulation and prediction. It is designed to improve the original landslides model (SLIDE) through the coupling of hydrological model (CREST) and to deliver an integrated system for predicting storm-triggered landslides. This model was developed by Professor Ke Zhang and the research team at the University of Oklahoma.
CREST model The CREST model is grid-based distributed hydrological model that can simulate the hydrological processes. The rainfall-runoff generation processes in CREST start from the canopy interception. After precipitation passes the canopy layer, the excess precipitation that reaches the soil surface can be divided into the surface runoff and infiltration according to the variable infiltration curve (VIC). This model assumes that the point infiltration capacity varies over an area that conform to certain rule. The overland and subsurface flows are further separated by the saturated soil hydraulic conductivity. Then the cell-to-cell routing of the overland and subsurface runoff is simulated using the multi-linear reservoir at each time step. CREST couples the runoff-generation process and the routing scheme so that it could better represent the interaction between the surface and subsurface flow.

The most important intermediate variable that link CREST and SLIDE is infiltration. The vegetation interception, surface runoff and infiltration were calculated through CREST and then the “effective” rainfall which can effect slope stability was obtained. Hydrological state and flux variables, such as soil moisture and infiltration, generated through the CREST modeling processes can be directly used as inputs to SLIDE. The FS of slope can be calculated to further determine whether landslides will happen or not.
Publication
He X, Hong Y, Vergara H, Zhang K, Kirstetter PE, Gourley JJ, et al. Development of a Coupled Hydrological-geotechnical Framework for Rainfall-induced Landslides Prediction [J]. Journal of Hydrology. 2016,543.
Metadata
| Precipitation | 4-km rainfall analysis product |
| Evapotranspiration | the North American Regional Reanalysis |
| DEM | 30-m resolution data |
| Landcover | global land cover produced by University of Maryland |
| Soil type | the State Soil Geographic |